Your ISP advertises 100 Mbps and you measure 95 Mbps on a speed test — so why does everything still feel slow?
Speed test results and perceived internet performance often have a frustrating gap between them. The test looks fine. Web pages still take a noticeable moment to load. Video calls freeze. Large files download slower than the numbers suggest they should.
The gap is real, and it's explained by several factors that a standard speed test doesn't capture — most notably latency, bufferbloat, and the difference between raw throughput capacity and what actually reaches applications.
What a speed test actually measures
A speed test measures throughput — how much data can be transferred per second between your device and the test server under ideal, controlled conditions. It's measuring the pipe's capacity, not the day-to-day performance of typical internet use.
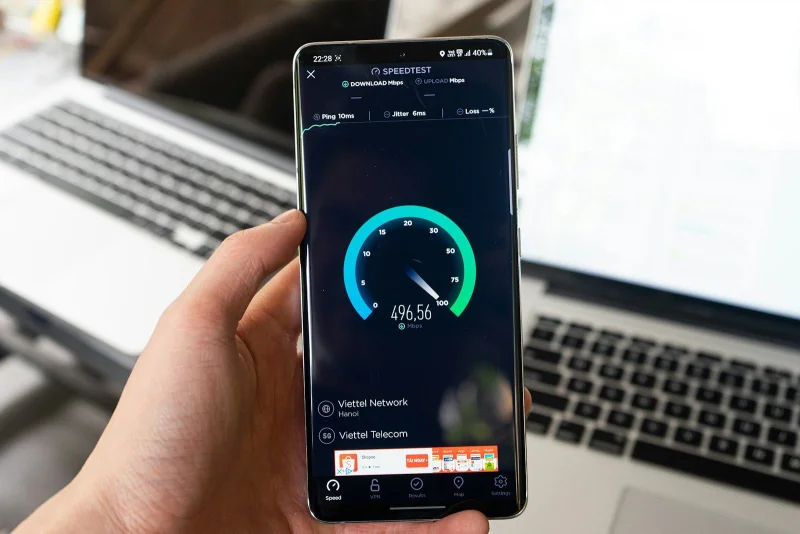
The three numbers a speed test produces:
Download speed: how quickly data can be pulled from the server to your device. Relevant for streaming, large file downloads, and page load (resources being fetched).
Upload speed: how quickly data can be sent from your device to the server. Relevant for video calls, file uploads, cloud backups, and sending large emails.
Ping (latency): the round-trip time for a small packet. Most speed tests show this but it's often the least-understood number — and for interactive applications, it often matters more than the throughput numbers.
Why high throughput doesn't equal fast performance
Latency affects everything interactive
Page load time isn't primarily about bandwidth — it's primarily about latency. A web page involves dozens of requests: HTML, CSS, JavaScript files, images, fonts, API calls. Each request requires a round trip before data starts flowing.
At 20ms latency, 50 requests take a minimum of 1 second in sequential round trips. At 80ms, the same requests take 4 seconds minimum — just in connection overhead, before any data is transferred.
HTTP/2 multiplexing and HTTP/3's QUIC protocol reduce this, but latency remains a fundamental constraint for interactive web performance. A 20 Mbps connection with 15ms latency often renders web pages faster than a 100 Mbps connection with 80ms latency.
Bufferbloat artificially inflates speed test scores
Standard speed tests saturate the connection with large transfers — ideal for measuring maximum throughput. But this saturation causes bufferbloat: buffers in your router fill up, latency spikes dramatically, and interactive applications suffer.
Many connections show excellent speed test numbers but have severe bufferbloat. The test completes its measurement before the buffer fill causes visible problems; real-world browsing suffers the latency consequences continuously.
The bufferbloat test: while a speed test is running, simultaneously ping a nearby server. If latency increases from 15ms to 200ms+ during the test, bufferbloat is present. The Waveform Bufferbloat Test (waveform.com/tools/bufferbloat) specifically measures this.
WiFi overhead reduces effective throughput
WiFi's advertised speeds (Wi-Fi 6: 9.6 Gbps theoretical) bear little resemblance to real-world performance. Actual throughput depends on:
- Distance and physical obstructions between device and router
- Interference from neighbouring networks on the same channels
- The number of devices simultaneously using the network
- The WiFi generation (WiFi 5 vs. WiFi 6)
- Whether the client supports the router's fastest protocols
A 100 Mbps fibre connection often delivers 95 Mbps on a wired connection and 40–70 Mbps on WiFi from across the house.
Server-side limitations
Speed test results measure throughput to the speed test server specifically. That server is typically well-provisioned and connected to fast infrastructure. The servers you actually use — your video call provider's infrastructure, your work VPN, a file storage service — may be more constrained.
A speed test to a local server might show 100 Mbps. An actual large download from a storage service with rate limits shows 20 Mbps. Both numbers are accurate; they're measuring different things.
Congestion on your ISP's network
ISPs oversubscribe their capacity — they sell more bandwidth than they physically have, relying on statistical usage patterns. During peak hours (evenings, weekends), when many customers use their connections simultaneously, per-customer speeds drop.
A 100 Mbps plan might deliver 95 Mbps at 3 AM and 55 Mbps at 8 PM on a weekday evening. Run speed tests at different times to understand your real-world variability.
Reading a speed test result properly
Check the latency number first, not the throughput. If latency is above 50ms, interactive performance will be degraded regardless of download speed. High latency to the speed test server suggests either a distant server or an overloaded network path.
Compare download vs. upload. Most home internet connections are asymmetric — much higher download than upload. This is fine for consumption (streaming, browsing) but problematic for production (video calls, screen sharing, cloud backups). If you regularly upload large files, the upload number matters more than the download.
Note the test server location. Speed tests to local servers show better numbers than to distant servers. For relevant results, select a server in the same region you actually use for your most important applications.
Run multiple tests at different times. A single speed test is a snapshot. Five tests spread across a day reveal the variance and average that characterises your connection's real performance.
Using the Speed Test on sadiqbd.com
- Start the test — the tool runs download and upload measurements against a test server
- Note latency — check ping before interpreting the throughput numbers
- Compare against your plan — are you getting close to what you pay for?
- Run at different times — identify peak-hour congestion if present
What to do if results are significantly below your plan
1. Test wired vs. wireless. If wired is fast and wireless is slow, the issue is WiFi performance, not your ISP connection. Solutions: router placement, channel selection, WiFi 6 upgrade, mesh network.
2. Test on the router itself or directly connected. Speed loss between your router and computer may indicate router limitations. Consumer routers often throttle at 200–400 Mbps even on faster connections.
3. Test at different times. Peak-hour slowdowns indicate network congestion. Contact your ISP if consistently slow.
4. Check for background applications. Cloud backup, automatic system updates, and streaming services consume bandwidth without obvious UI indication.
5. Contact your ISP. If speeds are consistently far below the advertised plan on a wired connection at off-peak hours, there may be a line fault, modem issue, or network problem warranting a service call.
Frequently Asked Questions
Is my 50 Mbps plan fast enough for Netflix 4K? Netflix 4K (Ultra HD) recommends 25 Mbps. A single 4K stream consumes roughly 15–25 Mbps. 50 Mbps is adequate for one 4K stream with headroom for other use; multiple simultaneous 4K streams would require more.
What speed do I need for remote work? Video calls (Zoom, Teams, Google Meet) use approximately 1.5–3 Mbps per participant. Screen sharing adds 1–2 Mbps. A 10 Mbps symmetric connection handles most remote work scenarios. The more important variable is latency and jitter — poor video call quality is usually latency or packet loss, not bandwidth.
What's a good latency for a home internet connection? Under 20ms to local servers is excellent. 20–50ms is good. 50–100ms is acceptable for most use cases. Over 100ms warrants investigation — either a distant test server or a connectivity issue.
Is the Speed Test free? Yes — completely free, no sign-up required.
A speed test number is a capacity measurement, not a performance guarantee. Latency, bufferbloat, WiFi conditions, and server-side factors all affect real-world experience. Understanding these dimensions turns "my internet is slow" from a vague complaint into a diagnosable problem.
Try the Internet Speed Test free at sadiqbd.com — measure your download speed, upload speed, and latency in seconds.