Fuel Economy Converter
Articles, guides, and in-depth tips for the Fuel Economy Converter — everything you need to get the most out of it.
✦ AI-powered — understands natural language

Drag Rises With Speed Squared: The Real Cost of 130 km/h

Why Official Fuel Economy Figures Were 40% Optimistic — NEDC, WLTP, and What Lab Tests Still Don't Capture
The NEDC fuel economy test was so widely gamed that the gap between official figures and real-world consumption reached 40% before WLTP replaced it. Here's how NEDC, WLTP, and EPA test cycles differ, what WLTP still doesn't capture (AC, cold start, >131 km/h driving), why UK and US mpg figures differ even beyond test cycle differences, and the L/100km vs MPG inverse relationship that creates perceptual distortions.
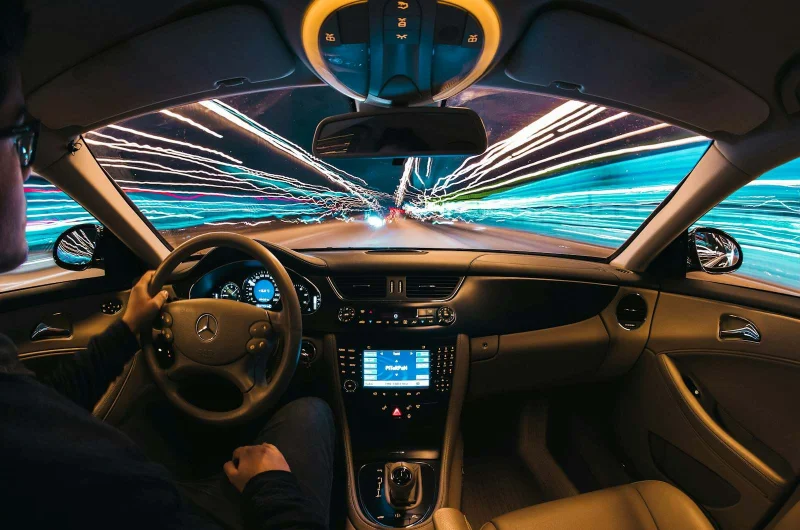
Why Your Car Never Achieves the Official MPG Figure — Lab Test Cycles vs Real-World Driving
Official fuel economy figures are generated in a lab using scripted driving cycles — no cold starts, no air conditioning, no hills, no traffic. The EPA applies a 20% correction to its raw figures; even so, 15-30% below official is entirely typical in real-world driving. Here's how the WLTP test cycle works, what it omits, why PHEV figures are particularly misleading for specific driving patterns, and how to calculate your actual fuel economy with the fill-to-fill method.
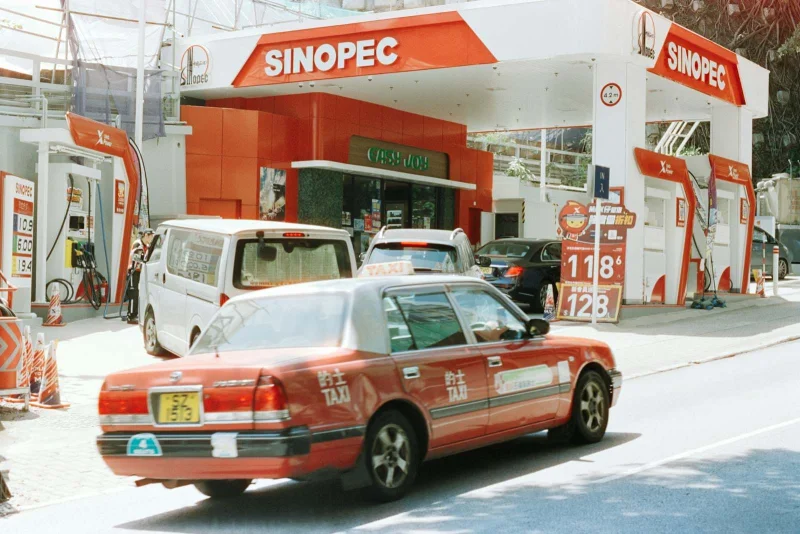
The MPG Illusion: Why 10→20 MPG Saves More Fuel Than 30→50 MPG
Going from 10 MPG to 20 MPG saves nearly 4x more fuel than going from 30 MPG to 50 MPG — even though the second jump looks "bigger" in MPG points. Here's why MPG's "distance per fuel" framing is the inverse of what actually determines fuel costs, why L/100km-style metrics avoid this "MPG illusion" entirely, and why fuel-economy improvements at the low end of the scale represent disproportionately larger real savings.

Hypermiling Techniques: The Driving Habits That Measurably Improve Fuel Economy
Driving at 70 mph instead of 80 mph cuts fuel consumption by approximately 25% on the motorway. Here's the aerodynamics behind that, plus tyre pressure, anticipatory braking, route planning, and the other hypermiling techniques with measurable impact.
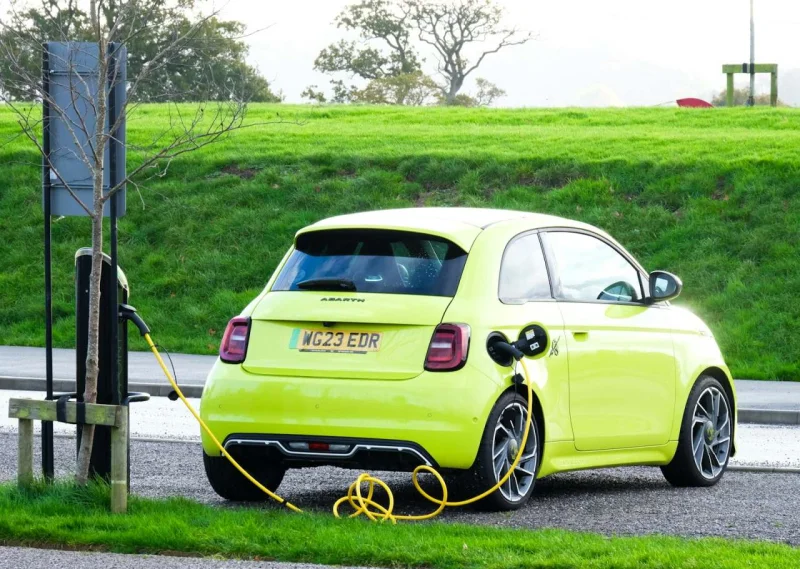
EV Efficiency vs Petrol: What kWh/100km Actually Means for Your Running Costs
EVs measure efficiency in kWh/100km or miles per kWh — and once you convert those numbers to petrol equivalents, the running cost comparison becomes clear. Here's the full calculation with home charging vs. public charging, and why winter dramatically affects real-world range.
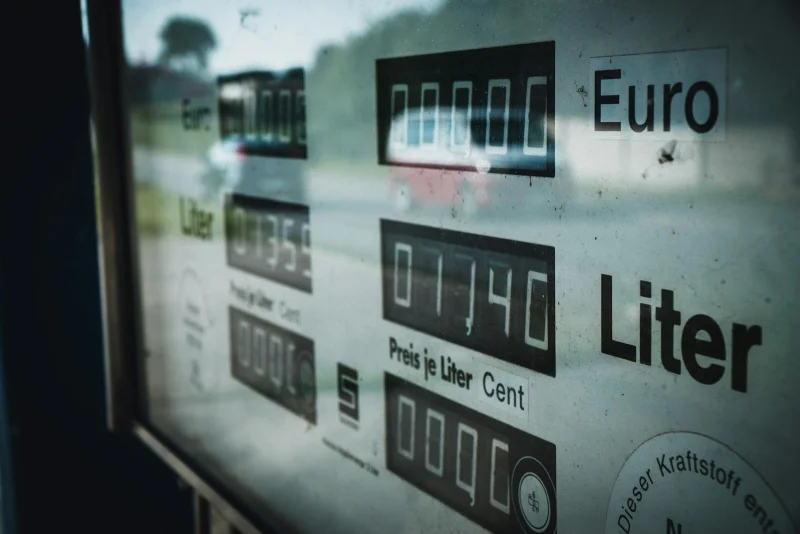
Fuel Economy Converter — Compare km/L, L/100km & MPG Across Markets
Learn why fuel economy comparisons across countries require unit conversion, how US and UK MPG differ, how to calculate annual fuel savings, and how to use a free fuel economy converter to compare any vehicles.
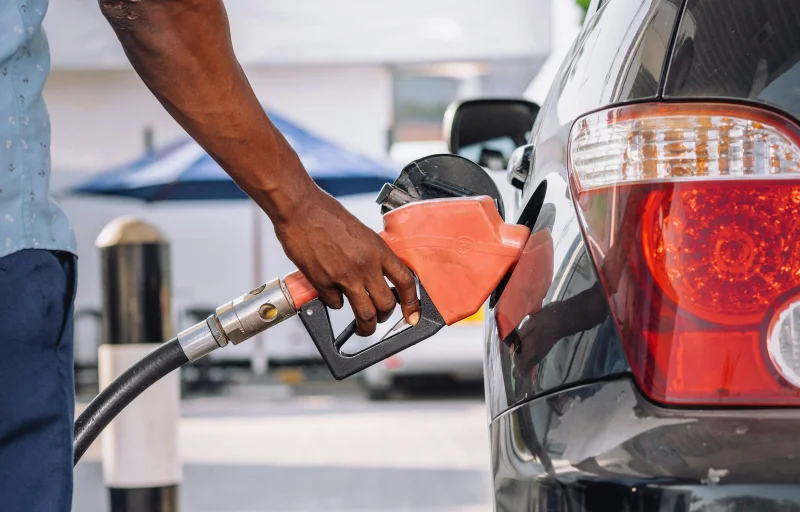
Fuel Economy Converter — MPG, L/100km & km/L Explained
Learn how to convert between MPG, L/100km, and km/L, why US and UK MPG differ, and how to calculate your actual fuel cost with a free fuel economy converter and real examples.